

Graphs for Hierarchical Inventories
Did you miss GraphTalk Barcelona 2025?
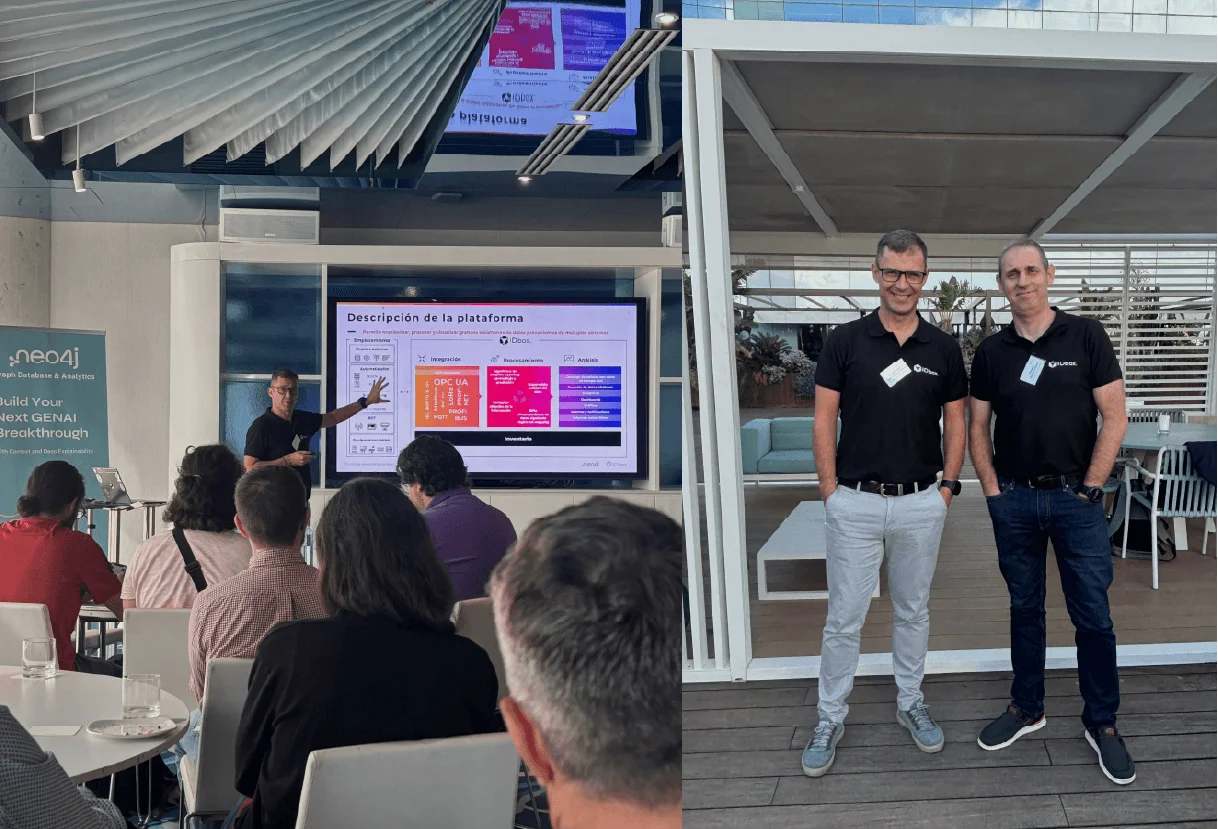
On October 14, we were part of GraphTalk Barcelona, the event organized by Neo4j that brought together experts in data and artificial intelligence. Our software architect, Miguel Ángel Fuentes, presented how traditional inventories, built on rigid tables and spreadsheets, are giving way to a new paradigm: graph-based models, where data points are connected and enriched with their own context.
This approach enables organizations to understand not only what assets they have, but also how they interact and influence each other in real time.

The Challenge of Traditional Inventories
In many companies across sectors like energy, industry, or infrastructure, inventory systems have grown in a disorganized way over the years. Assets that depend on one another are not connected in the data model, operational changes take days or weeks to update, and there’s heavy reliance on Excel or tools that don’t scale.
The result: fragmented visibility, slow decisions, and limited ability to anticipate critical incidents.
That’s why more and more organizations are turning to smarter, more connected alternatives that efficiently link information across systems.
How Graphs Are Changing the Game
At IDboxRT, we’ve seen firsthand how modeling inventories with graphs transforms business operations.
Each asset becomes a node connected to others, reflecting real and dynamic relationships. This makes it possible to:
- Navigate complex hierarchies in seconds.
- Detect cascading impacts when failures occur.
- Integrate real-time data from SCADA, IoT, or ERP systems.
- Scale operations without redesigning the entire structure.
In a real case from the energy sector, with hundreds of thousands of nodes and millions of relationships, a company reduced the time to query critical data by 70%, gaining a holistic view of assets and events, without silos.
This not only boosts operational efficiency but also prepares infrastructures for growth and renewable integration.
What This Means for Organizations
The value of graph technology goes beyond data modeling, it redefines how operations are managed.
Any organization dealing with hierarchical assets or complex interdependencies, from factories to utilities, can apply this approach to achieve greater agility, traceability, and analytical power.
Decisions move from being reactive and assumption-based to being data-driven and real-time informed.
Our Approach at IDboxRT
At IDboxRT, we ensure that every signal, metric, and relationship translates into operational intelligence.
Our goal is not just to display data, but to turn it into actionable decisions that generate tangible business value. Through graph-based modeling, we provide full visibility, early problem detection, and a more strategic way to manage inventories.
If your organization is ready to optimize asset management and turn data into a true operational asset, we can help design and implement a tailored graph model. It’s not just about technology, it’s about driving faster, safer, and smarter decisions across your operations.
Contact us and discover how graph technology can turn your inventory into a real operational advantage.
Leave a Reply